
For three years, SaaS operators optimized for the metric that impressed investors — ARR growth rate — while ignoring the metric that predicts survival: CAC payback period. In 2026, the efficient-growth mandate is clear: investor priorities flipped, but many marketing teams still run 2021 playbooks, optimizing for MQL volume while their CFOs get measured on Rule of 40.
This isn't a communication failure between departments. It's a metric architecture failure, and no amount of quarterly alignment fixes it without changing what the marketing team is actually scored on.
The cost of keeping that architecture broken is now concrete. Zylo's 2026 SaaS Management Index — drawn from more than 40 million licenses and $75 billion in SaaS spend — found that 78% of IT leaders experienced unexpected charges tied to AI features or consumption-based pricing, and 61% cut projects due to unplanned SaaS cost increases. Meanwhile, average SaaS spend rose 8% year-over-year even as app portfolios held flat at 305 applications.
These aren't vendor problems. They're symptoms of GTM systems designed to track activity, not efficiency. When your measurement stack optimizes for MQL volume and your board asks about CAC payback, you're not slow to respond — you're answering a different question entirely.
Growth efficiency — defined as sub-18-month CAC payback, Rule of 40 above 40, and NRR above 110% — is the only sustainable moat available to Series A–C SaaS companies in 2026.
Not because capital is tight (though it is), but because companies that hit all three thresholds now will outspend, outlast, and outcompound competitors when capital returns. Efficiency isn't the retreat. It's the setup for the metrics that boards actually reward.
What follows is a framework for rebuilding the GTM dashboard around those three constraints — with stage-specific thresholds, a funnel diagnostic, and a weekly operating cadence that makes the covenant executable, not aspirational.
The Metric Divorce: Why Your Dashboard Is Lying
The CMO and the CFO are not optimizing for the same game. The CMO's dashboard measures MQL volume, pipeline created, and cost per lead. The CFO's dashboard measures CAC payback period, gross margin, and net revenue retention. In a high-growth, low-cost acquisition environment, these two systems can coexist — MQL volume correlates loosely with pipeline, pipeline correlates loosely with revenue, and the math closes well enough that no one audits the middle.
That correlation would have held in 2019. It started breaking in 2022. It's fully broken now.
The mechanism is mid-funnel leakage. When MQL-to-SQL conversion drops below the 15% threshold practitioners use as the ICP misalignment signal, every dollar of top-of-funnel spend gets silently amplified downstream. You're paying to generate leads your sales team cannot close — and blended CAC reporting hides it because it never isolates where spend is actually lost.
The result is a CAC number that looks explainable at the aggregate level and catastrophic at the channel level, and a marketing team with no incentive to find the leak because their KPI is MQL volume, not pipe cost per dollar of ARR.
Industry data underscores the structural nature of this problem. The KeyBanc/Sapphire Ventures 2024 Private SaaS Survey found the median CAC payback period had improved to approximately 20 months — down from a peak of roughly 23 months in 2022 — but still well above historical norms of 12–14 months, signaling the efficiency gap remains wide even as it slowly narrows.
"CAC rarely breaks because of ad spend — it breaks because handoffs, targeting, and measurement aren't tight." — Tusar Ranjan Rath, Director of Marketing Operations & Growth
The instinct to pause LinkedIn campaigns or cut the Google budget when CAC spikes is understandable and almost always wrong. You're adjusting a dial on a broken system.
The solution isn't better communication between the CMO and CFO. It's a unified operating system with three co-equal constraints — one that forces both functions to answer for the same financial outcome.
The Efficiency Operating Covenant: Three Metrics, One Dashboard
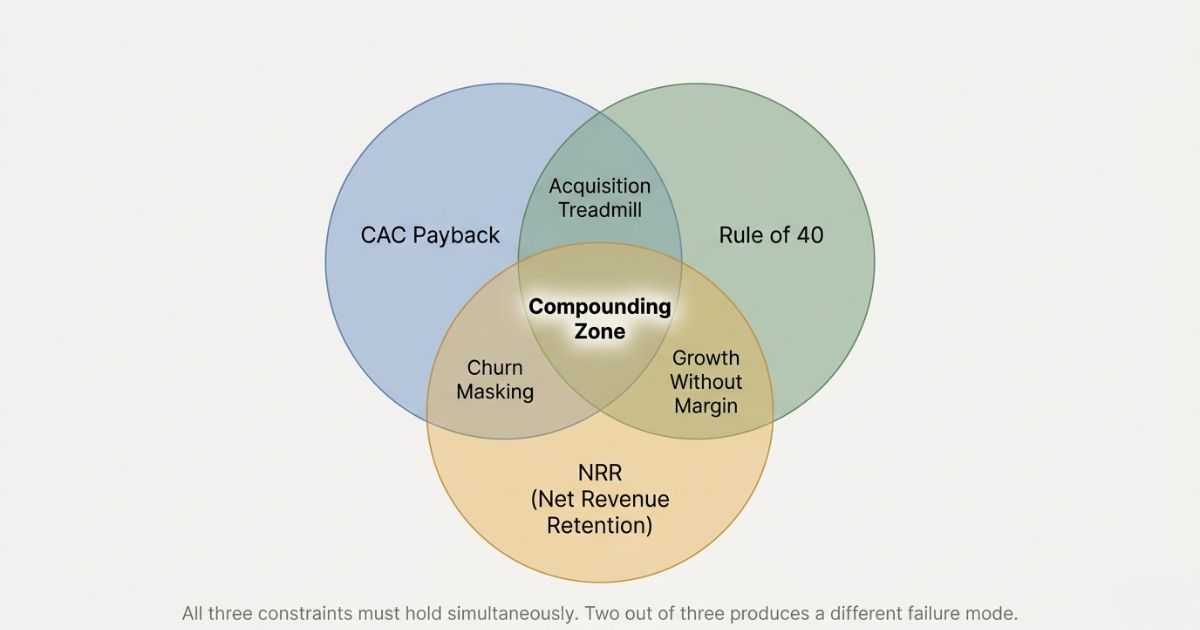
The Efficiency Operating Covenant is a three-metric framework enforced as a single operating system, not three separate reports. Each metric is necessary. None is sufficient alone. Together they encode efficient growth into weekly practice.
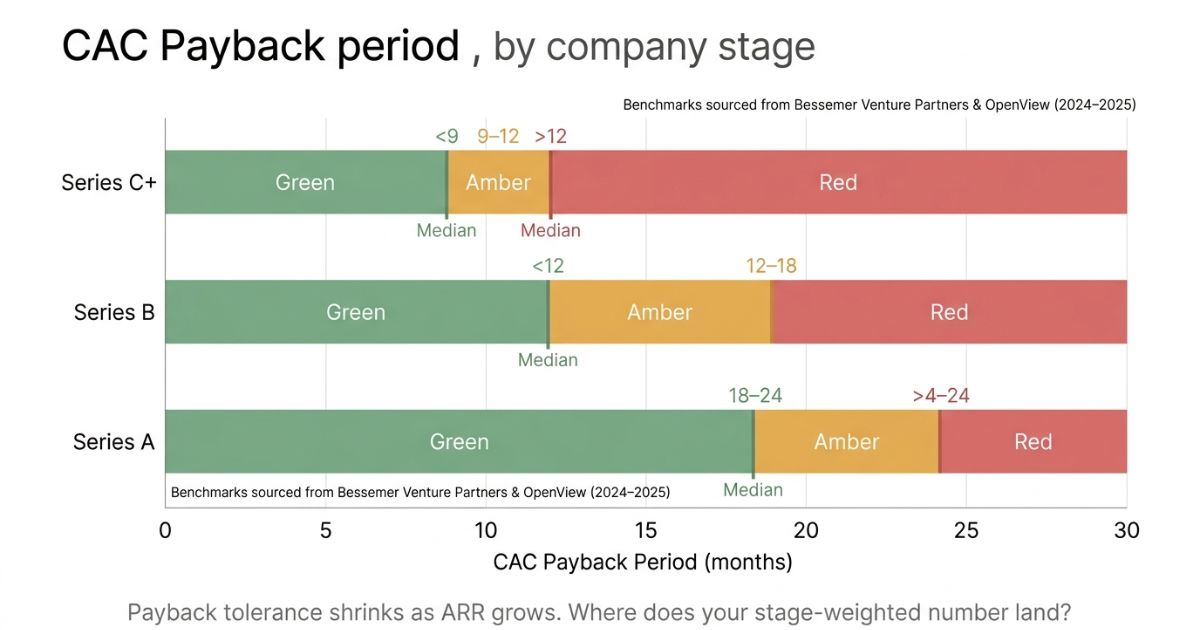
CAC Payback: Under 18 Months (Series A/B), Under 12 Months (Series C+)
Measure CAC payback by channel, not blended. Blended CAC payback is a reporting metric; channel-level CAC payback is an operating metric. The distinction matters because failure hides in the blend.
Drawing on the High Alpha 2025 SaaS Benchmarks (800+ companies) and the KeyBanc/Sapphire Ventures 2024 survey, workable targets are:
- Series A: 18–24 months
- Series B: 12–18 months
- Series C+: sub-12 months
The 2024 industry median near 20 months — improved from approximately 23-month peaks in 2022 — means companies operating at or above this band aren't just inefficient: they're moving in the wrong direction while the benchmark improves around them.
There's a legitimate objection: NRR above 110% can extend payback tolerance because expansion revenue shortens the effective recovery timeline. As Kyle Poyar, co-founder of Tremont and formerly of OpenView, has noted, companies with NRR of 100–120% can defensibly operate at 12–18-month payback, while those with NRR above 120% may tolerate longer depending on cash reserves.
A Series B company with 115% NRR can live at 20-month payback. A Series B with 95% NRR at 20 months is on an acquisition treadmill — spending to replace churned revenue rather than compound it. This is why all three metrics must be read together.
Rule of 40: Above 40, With AI Costs Reclassified to COGS
Rule of 40 — the sum of revenue growth rate and EBITDA margin — is the shorthand for efficiency. Bessemer's "Rule of X" research found that a 1% increase in revenue growth rate has 2.3x the positive valuation-multiple impact versus a 1% increase in free cash flow margin, confirming the threshold is real and growth composition matters.
The problem is that many teams calculate it dishonestly. AI serving costs — inference, API usage, compute tied to product delivery — belong in cost of goods sold, not R&D. Burying them in R&D inflates gross margin and produces a Rule of 40 score that collapses at diligence.
Zylo's 2026 data shows AI-native SaaS spend grew 108% year-over-year, with app portfolios flat but unit costs rising 8% annually. If your Rule of 40 rides on a gross margin that hasn't absorbed those costs, you don't have a Rule of 40 score — you have a projection.
Reclassify now. Gross margin will compress — four to six points is typical for companies with meaningful AI delivery — but a Rule of 40 built on accurate inputs is worth more in a board conversation than an inflated score that won't survive a CFO's diligence call. According to Aventis Advisors' Q3 2025 analysis of 58 actively traded public SaaS companies, only 17% currently exceed the Rule of 40. That scarcity is exactly what makes clearing it a competitive signal.
NRR: Above 110%, Tracked at Six-Month Cohort Intervals
NRR is the compounding variable that CAC payback and Rule of 40 can't capture alone. A company at 112% NRR is generating expansion from its base that shortens effective payback, raises the gross margin floor, and compounds ARR without incremental acquisition cost. A company at 95% NRR is spending to stand still.
High Alpha's 2025 SaaS Benchmarks research reinforces the compounding effect: companies pairing high NRR with short CAC payback nearly double their growth rates and Rule of 40 scores relative to peers with weaker retention or longer paybacks.
Track NRR at six-month cohort intervals, not annually. Annual tracking masks the early signal — the cohort that starts contracting at month seven looks fine until it doesn't. Six-month cohorts give you the intervention window.
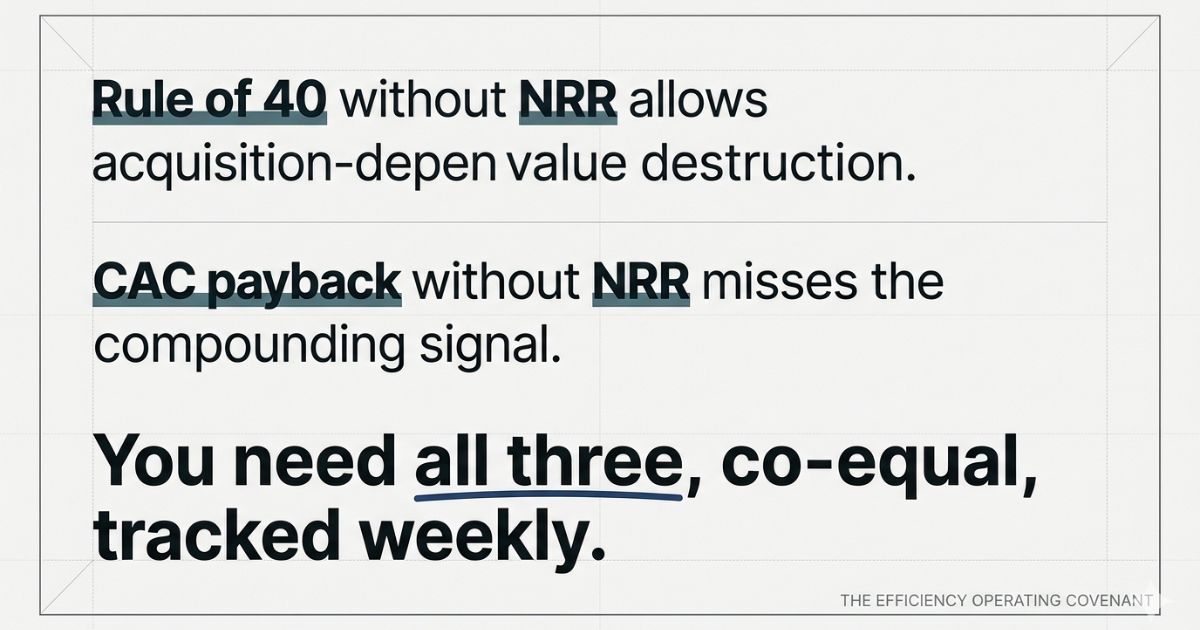
The three metrics interlock:
- Rule of 40 without NRR allows acquisition-dependent value destruction.
- CAC payback without NRR misses the compounding signal.
- NRR without CAC payback hides whether the base was efficiently built in the first place.
All three, co-equal, tracked weekly.
The Efficiency Operating Covenant is a three-metric operating system for SaaS efficient growth: keep CAC payback under 18 months (Series A/B) or 12 months (Series C+), sustain NRR above 110% on six-month cohorts, and maintain a Rule of 40 over 40 with AI/usage costs classified in COGS.
The SaaS KPI Diagnostic Tree
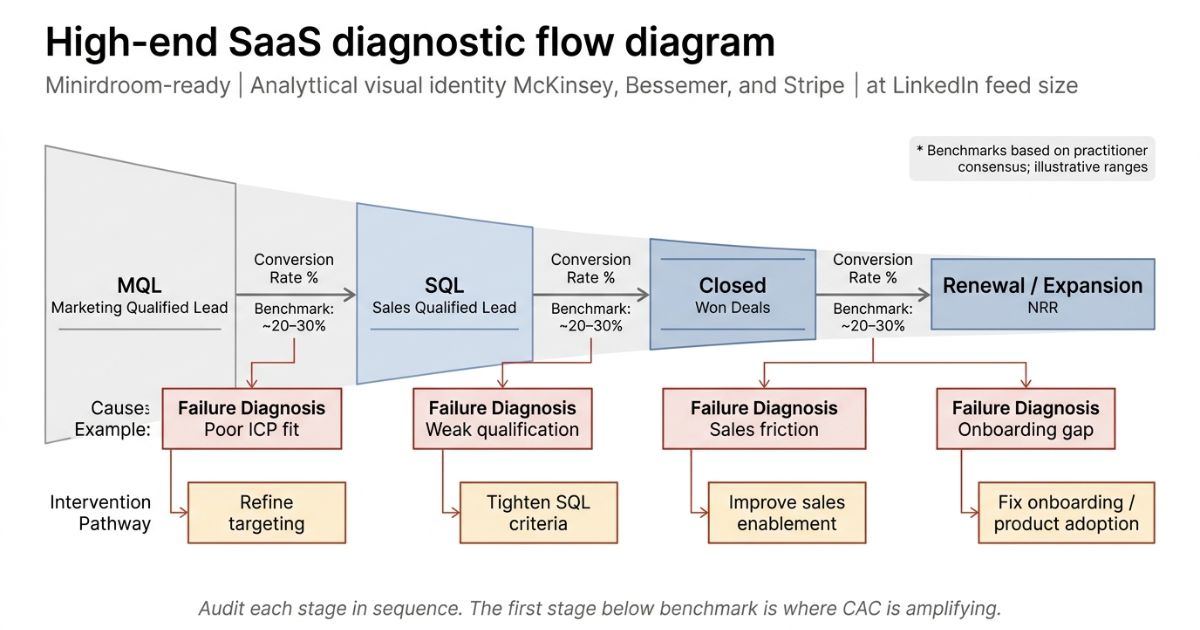
Thresholds without diagnostic power are useless. If your CAC payback is 22 months and your target is 18, the covenant tells you you're outside the zone — it doesn't tell you where the system is breaking. The diagnostic tree does.
Start at the funnel stage with the highest drop-off rate. There are three candidate failure points, each implying a different fix.
MQL-to-SQL Below 15%: ICP Misalignment
This signals ICP misalignment or targeting failure. This is a demand generation problem, not a sales problem. The leads exist; they're the wrong leads. The fix is ICP tightening before spend scaling — adding budget to a misaligned ICP campaign accelerates the problem.
One Series B company at $8M ARR discovered MQL-to-SQL conversion at 8% against a 15% benchmark. Rather than cutting budget, the team reoriented ICP targeting while holding spend constant. The result: a 32% reduction in CAC within 90 days, driven entirely by targeting precision, not spend reduction. That's the distinction between fixing a system and adjusting a dial.
SQL-to-Close Below Stage Benchmark: Sales Process Friction
This signals sales process friction or pricing misalignment. This is where the pricing-in-calls diagnostic applies. Testing close rates across price points in actual sales calls — rather than on a pricing page with two-to-three-month A/B cycles — produces signal in weeks.
One operator's call-level pricing analysis surfaced the finding that a $149/month plan had only marginally lower close rates (28%) than the $299 plan (31%) — with a 50% margin improvement. Running that test on a website would have taken a quarter. Running it in calls took three weeks. The recovered revenue identified through that analysis — $47,000 invisible in quarterly reporting — surfaced in week three of a weekly iteration cycle.
Closed-to-Renewal Below 90%: Product-Market Fit Gap
This signals a product-market fit gap, not a sales or marketing problem. Throwing expansion campaigns at a retention problem converts CAC spend into churn recovery spend. The fix is product investment, onboarding redesign, or ICP narrowing — not a bigger SDR team.
Measure cost-per-progression at each stage: pipeline cost per dollar of ARR, not blended CAC. This replaces MQL volume as the primary marketing KPI and connects directly to the covenant's payback threshold. When pipe cost per dollar of ARR rises, the diagnostic tree tells you where to look first.
The Weekly Revenue System (Not Quarterly Planning Theater)
If the diagnostic tree reveals where the system is breaking, weekly iteration is what closes it. Most SaaS operators run 90-day strategy cycles. That's too slow when CAC efficiency is the primary board question every quarter.
The weekly operating cadence is not a BI build. It's three numbers from dashboards you already have, reviewed in 15 minutes.
- Weekly: Track CAC payback by your top two or three channels, NRR cohort movement at the six-month mark, and gross margin post-AI COGS reclassification. These three inputs tell you whether the covenant is holding or breaking, and at which constraint.
- Bi-weekly: Run one pricing signal test in sales calls. Measure close rate by price point across comparable prospects. This is faster than any website test and directly affects the Rule of 40 calculation.
- Monthly: Recalibrate covenant thresholds against actuals. If Series B NRR has moved from 108% to 113%, your payback tolerance can expand. If gross margin compressed from the AI COGS reclassification, the Rule of 40 target adjusts. The covenant is a living operating system, not a fixed benchmark.
"Do this weekly and you'll feel compounding revenue, not vanity wins."
The compounding is structural — each iteration tightens the system, reduces mid-funnel leakage, and improves channel-level payback without incremental spend. It's not inspiration. It's feedback-loop discipline.
The strongest objection to weekly tracking is that it creates noise and distracts from strategic priorities. The rebuttal: quarterly feedback loops catch system breaks after they've compounded into CAC crises. The $47,000 recovered via call-level pricing analysis was invisible in quarterly reporting. Weekly cadence doesn't create noise — it surfaces the signal that quarterly cycles bury.
Pricing–COGS Guardrails for AI and Usage Models
Efficient growth fails when variable delivery costs outpace price realization. If you're shipping AI features or usage-metered modules, set guardrails that protect Rule of 40 and channel-level CAC payback:
- Reclassify AI/usage delivery to COGS. Inference, vector DB, third-party LLM/API calls, and per-resolution support costs belong in COGS. This anchors honest gross margin.
- Establish gross margin floors by plan or unit. For example: 70% for core SaaS, 60–65% for AI-augmented features; review monthly.
- Map usage tiers to cost curves and value metrics. Tie unit economics to customer-visible metrics (seats, credits, messages, resolutions) and ensure break-even occurs well below median cohort usage.
- Price-test in calls before publishing. Validate willingness to pay against COGS with bi-weekly call tests; publish only after you can hit the margin floor at P50 usage.
These steps keep Rule of 40 math defensible and prevent silent margin erosion as adoption scales.
Expansion Efficiency: Engineering NRR Above 110% Without More CAC
Expansion is the cheapest revenue you'll ever book — and it shortens CAC payback period without touching top-of-funnel spend.
- Package for natural step-ups. Gate high-value workflows (security, automation, AI assistance) behind higher tiers with clear activation milestones.
- Treat CS as capital allocation. Assign CSM time to cohorts with sub-90-day payback on expansion plays; throttle where expansion LTV/CAC is weak.
- Use triggered plays, not generic blasts. Expansion offers tied to product signals (usage thresholds crossed, multi-team invites, feature adoption) outperform calendar-based campaigns.
High Alpha's data and operator experience converge: pairing 110%+ NRR with sub-18-month CAC payback correlates with nearly double the Rule of 40 outcomes versus peers. That's expansion efficiency in action.
Efficiency as Aggression, Not Retreat
The dominant framing of the 2022–2024 efficiency era — efficiency as a defensive posture forced by a funding winter — was wrong, and it damaged how operators think about the tradeoff.
Efficient growth in 2026 isn't a defensive posture. It's the offensive condition that lets you outspend, outlast, and outcompound competitors when capital returns.
Companies that hit sub-18-month CAC payback, Rule of 40 above 40, and NRR above 110% this year are building capital reserves that their growth-at-all-costs competitors are burning through. When the funding environment shifts — and it will — the efficient company arrives with structural advantages:
- A lower cost to acquire the next customer
- Expansion revenue that compounds ARR without incremental spend
- A gross margin that supports the next investment cycle
Multiple market analyses through 2025 indicate that companies achieving Rule of 40 scores above 50 combined with NRR above 120% frequently command 7x+ EV/Revenue in both public and private markets, compared to 3–4x for those falling below the Rule of 40 threshold — a spread that widens as the bifurcation between premium and average SaaS businesses accelerates.
The companies cutting fastest now are doing defensive efficiency — reducing spend to survive. The companies rebuilding systems now are doing offensive efficiency — lowering CAC structurally, compounding NRR, and building the dashboard architecture that will let them scale without the leakage that plagued the 2021 growth cycle.
That distinction is the one that matters at a board meeting. The CFO who can show CAC payback improving by channel — not just holding flat — is making a different argument than the one who can show the budget was cut. One is retreat. One is a system working.
Conclusion: Make Efficient Growth Your 2026 Operating System
The Efficiency Operating Covenant resolves the CMO–CFO metric divorce by giving both functions the same three numbers to answer for. CAC payback by channel connects marketing spend to capital efficiency. Rule of 40 with honest gross margin connects operating performance to investor expectations. NRR at six-month cohort intervals connects retention to the compounding signal that makes the other two metrics sustainable.
The diagnostic tree tells you which funnel stage is amplifying your CAC. The weekly cadence makes the covenant operational rather than aspirational. And the reframe — efficiency as aggression, not retreat — gives your board the story that links near-term discipline to long-term advantage.
For your next board meeting:
- Retire MQL volume as a primary marketing KPI. Replace it with pipeline cost per dollar of ARR and CAC payback by channel.
- Reclassify AI serving costs to COGS this week.
- Pull NRR at six-month cohort intervals.
You don't need all three covenant thresholds to be green — you need to know which one is amber and why.
Run the Efficiency Covenant Calculator tonight — input your channel CAC, gross margin, and NRR to get your payback timeline, Rule of 40 score, and NRR sensitivity — before your next board prep. The companies that survive the next 24 months won't be the ones that grew fastest in 2021. They'll be the ones that rebuilt their operating systems while everyone else was still arguing about MQL volume.