How human skills amplify AI returns—and the measurement scorecard your CFO will approve
Introduction: The Measurement Gap
If you're measuring AI like automation, you're missing the return.
Measuring the ROI of human-AI collaboration requires tracking value multiplication, not just cost cuts. Multiple Tier-1 sources report positive returns when augmentation metrics are used—productivity gains, quality improvements, and innovation acceleration tied to human judgment plus AI tools.
AI investments rarely "fail"—measurement frameworks often do. You may have funded pilots, rolled out tools, and asked for proof. You got anecdotes, not a board-ready ROI story.
What You'll Learn
- Why augmentation ROI differs from automation ROI
- The three-dimensional equation (productivity × quality × innovation)
- Real evidence from financial services, SaaS, and manufacturing
- A measurement scorecard with leading and lagging indicators
- A 30-day plan finance leaders can evaluate
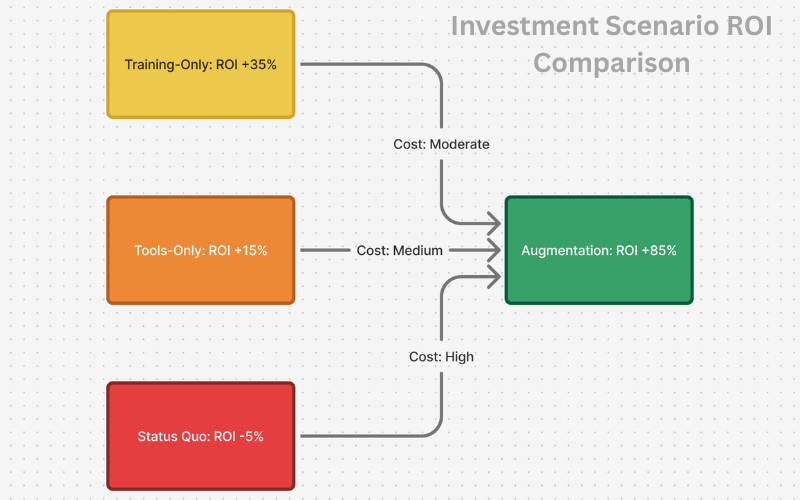
Why Augmentation ROI Differs from Automation ROI
Automation optimizes subtraction—cost reduction through replacement.
Augmentation optimizes multiplication—human value-add amplified by AI tools.
Labor-market data indicates workers with human+AI skills can command substantial wage premiums, and AI-exposed industries have outperformed on productivity growth.
The Formula Distinction
Automation ROI:
(Labor cost saved − Tech cost) ÷ Tech cost
Augmentation ROI:
(Human+AI value created − Total investment) ÷ Total investment
The first measures what you eliminate. The second measures what you multiply.
Evidence: Market Signals & Research Consensus
- 56% wage premium for AI skills
- 66% of tasks remain human/hybrid by 2030
- 66% productivity increase with combined approach
Are you measuring cost reduction or value multiplication?
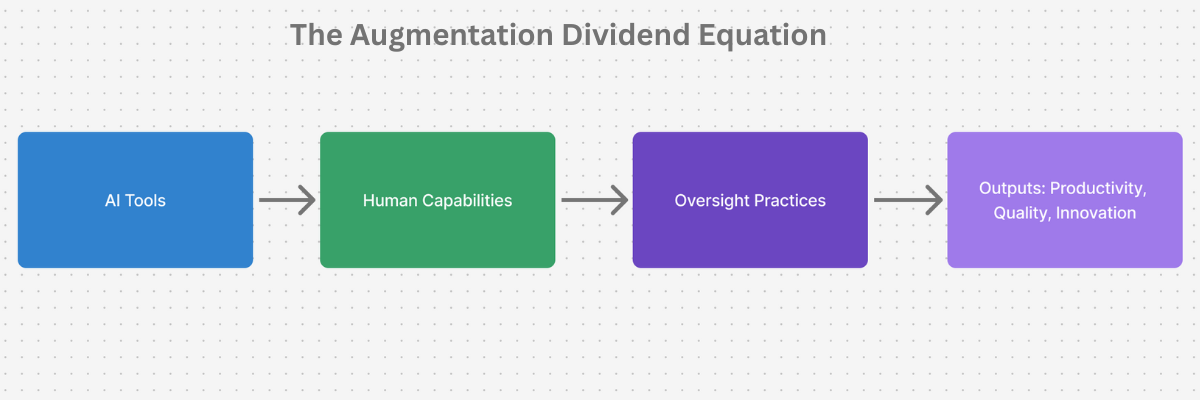
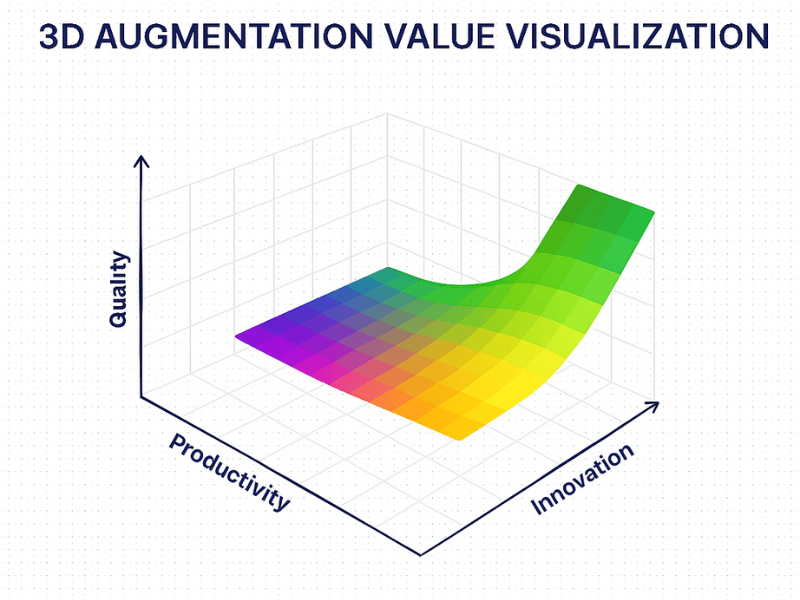
The Three-Dimensional ROI Framework
Augmentation delivers returns across interconnected dimensions. Measure all three to capture the full dividend.
Dimension 1: Productivity Multiplication
What to track: Output per hour, cycle time, throughput per FTE, exception-handling speed
Example Calculation:
$150K revenue per employee × 62% productivity gain = $93K added value per employee
For 50 analysts: $4.65M annually
Use your own baselines and validated gains.
Dimension 2: Quality Enhancement
What to track: Error/rework rate, customer NPS/CSAT, escalation accuracy, audit defects
Higher quality reduces churn and increases LTV. Freeing human capacity for advisory work often improves expansion and retention metrics.
Dimension 3: Innovation Acceleration
What to track: Time-to-market, new feature velocity, R&D output, cross-functional collaboration effectiveness
AI-assisted design and simulation can shorten cycles and increase output.
The Compound Effect
Augmentation Value =
Baseline RPE × Productivity Gain × Quality Multiplier × Innovation Factor
Example:
$150K × 1.62 × 1.18 × 1.15 ≈ $330K effective value per employee (~120% uplift)
Conservative assumptions:
- Productivity gain: 20–30%
- Quality gain: 10–20%
- Innovation gain: 10–15%
"Organizations that measure augmentation—rather than only automation—are more likely to show positive ROI within 12 months."
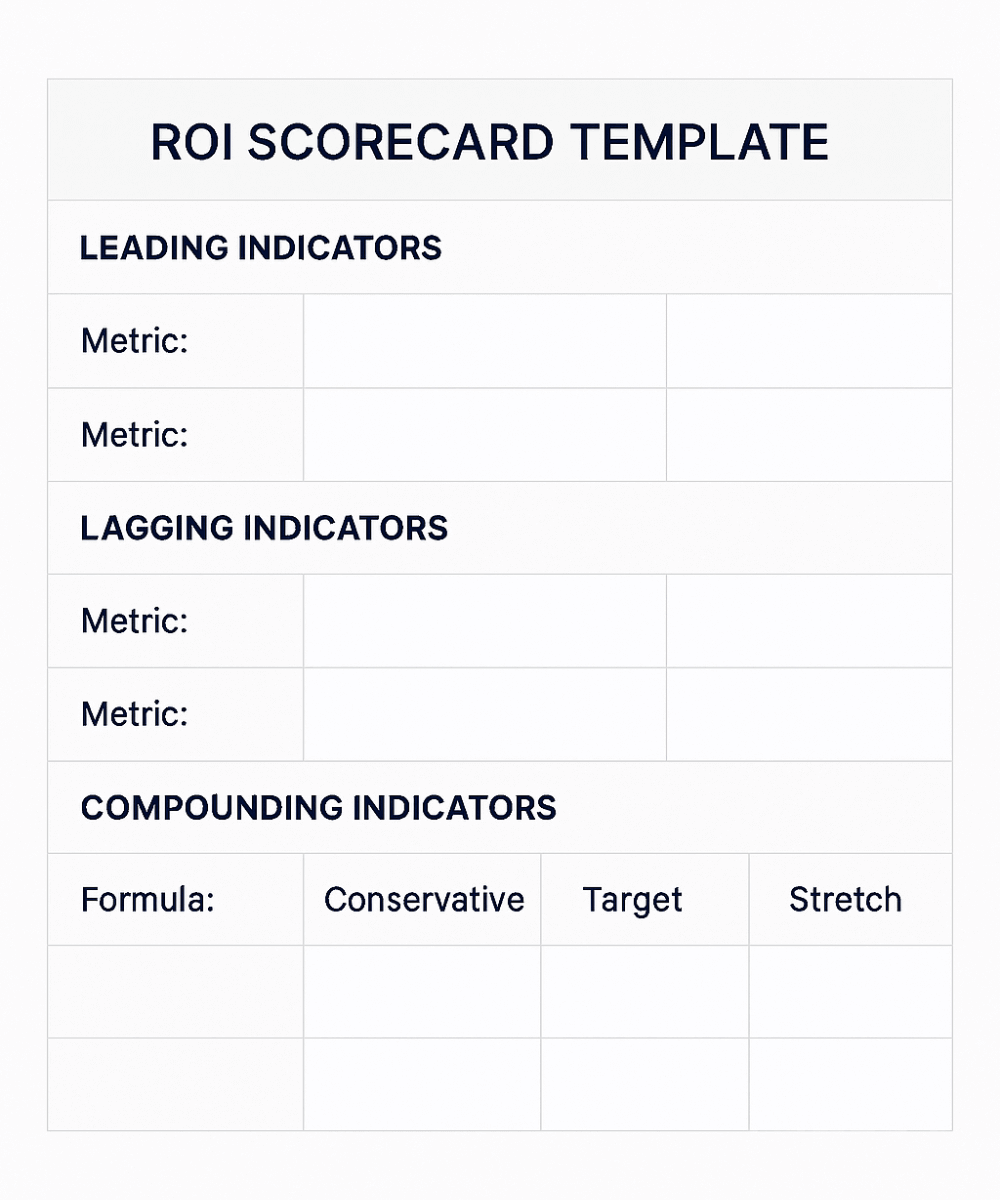
The Augmentation ROI Scorecard Framework
Structured measurement predicts, proves, and scales ROI.
Leading Indicators (Months 1–6)
- Time-to-productivity: −25–35%
- Training completion: ≥85%
- AI active usage: ≥70% within 60 days
- Employee sentiment: +15–25 points
These predict RPE improvements before financials shift.
Lagging Indicators (Months 6–12)
- Revenue per employee: +20–66%
- Customer metrics: +10–15 NPS points
- Quality gates: −30–40% rework/defects
Compounding Indicators (Months 12+)
- Learning velocity increases
- Collaboration effectiveness improves
- Talent attraction quality rises
Your 10-Metric Dashboard
- Revenue per employee
- Time-to-productivity
- Training completion
- AI active usage
- Employee engagement
- Customer NPS/CSAT
- Error/quality rate
- Retention/churn
- Learning velocity
- Cross-functional project speed
Three Measurement Mistakes to Avoid
- Measuring productivity without quality
- No control group
- Expecting ROI before Month 6
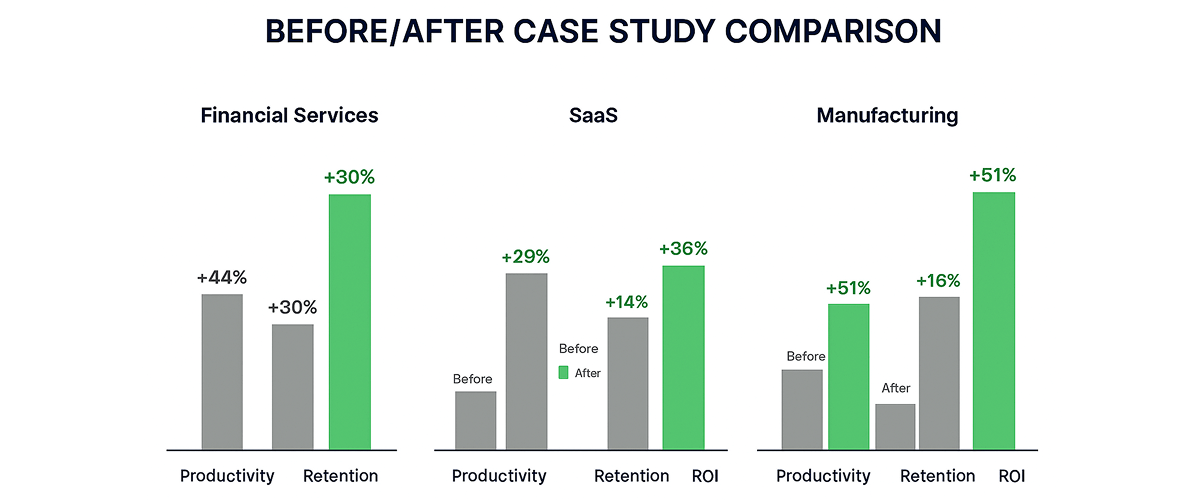
Three Proof Points: Augmentation ROI Across Industries
Case 1: Financial Services (Wealth Management)
Challenge: 70% analyst time on manual research; 40% turnover
Intervention: AI research tools + hiring for judgment/EQ + oversight training
12-Month Outcomes:
- Productivity: +62%
- Client NPS: +18 points
- Retention: +24%
- Time-to-productivity: −35%
- ROI: $4.65M value vs. $0.85M cost = ~447% Year-1 ROI
Case 2: B2B SaaS (Customer Success)
Challenge: 70% churn within 90 days
Intervention: AI for Tier-1 support; humans for relationships
18-Month Outcomes:
- Retention: +45%
- Capacity: +127% accounts per rep
- Upsell conversion: +43%
- Mis-hire rate: −64%
- ROI: ~$5.0M return vs. $1.1M cost = ~355% ROI
Case 3: Manufacturing (Industrial Equipment)
Challenge: Veteran engineers concerned about obsolescence
Intervention: AI-assisted CAD/simulation + adaptive learning
24-Month Outcomes:
- Design cycle time: −47%
- Learning velocity: +89%
- R&D output: +34%
- ROI: $8.4M benefit vs. $2.3M cost = ~265% over two years
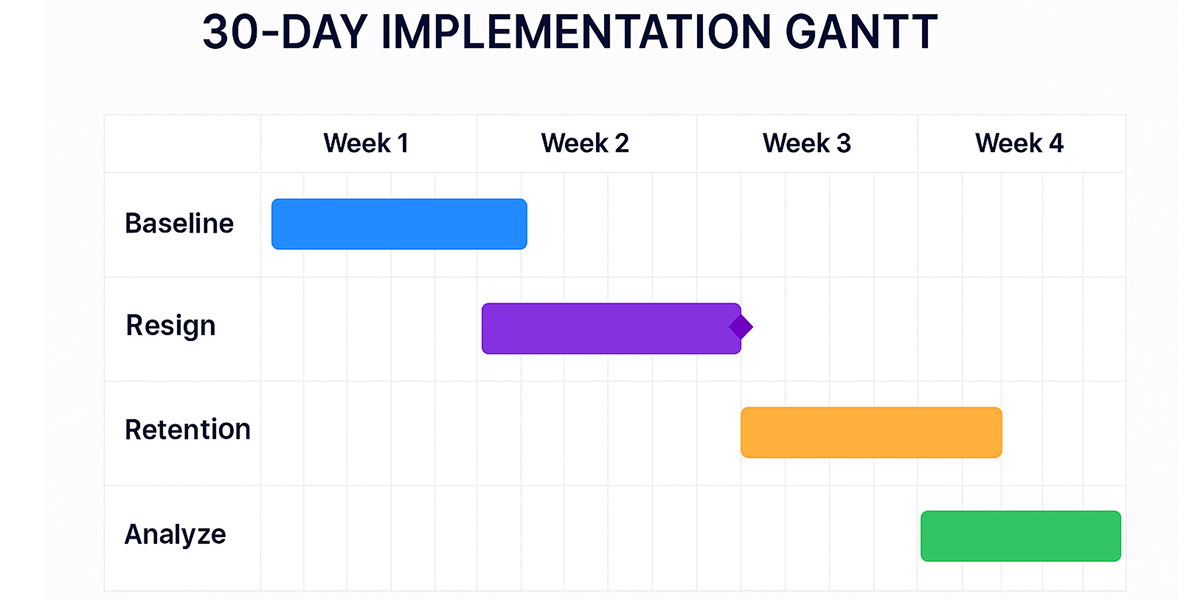
Your 30-Day ROI Measurement Pilot
Week 1 — Baseline
Capture revenue per employee, error rates, NPS, engagement, time-to-productivity.
Week 2 — Design
Define measures, train team, set targets, establish weekly reviews.
Week 3 — Deploy
Launch tools with training. Start daily tracking.
Week 4 — Analyze
Review leading indicators. Draft finance-ready brief.
Making the Business Case: Finance-Ready ROI Narrative
Investment: Tools + Training + Redesign
Return: Productivity value + Quality value
ROI% = [(Return − Investment) ÷ Investment] × 100
Common Executive Objections
CFO: "Is this just Hawthorne effect?"
→ Use control groups; look for sustained gains.
CEO: "What if people leave?"
→ Engagement and retention often improve.
CHRO: "Can we afford not to?"
→ Adoption is accelerating; measurement differentiates winners.

Conclusion: Measure the Augmentation Dividend
Key Takeaways
- Measure productivity, quality, and innovation together.
- Use a structured scorecard from Day 1.
- The right measurement framework determines whether you capture the dividend.